05 — First Dashboard — BI Surface
Time : 5 min · Persona : alice or carol · Path : A or B
The BI surface bundles pre-built dashboards, ad-hoc SQL Lab, and chart-level sharing. This chapter takes you through opening a dashboard, filtering it, and sharing the result.
Pre-requisites
- You completed chapter 04 (or skipped it).
- Banking demo data is seeded (default on the live demo).
Step 1 — Open the BI surface
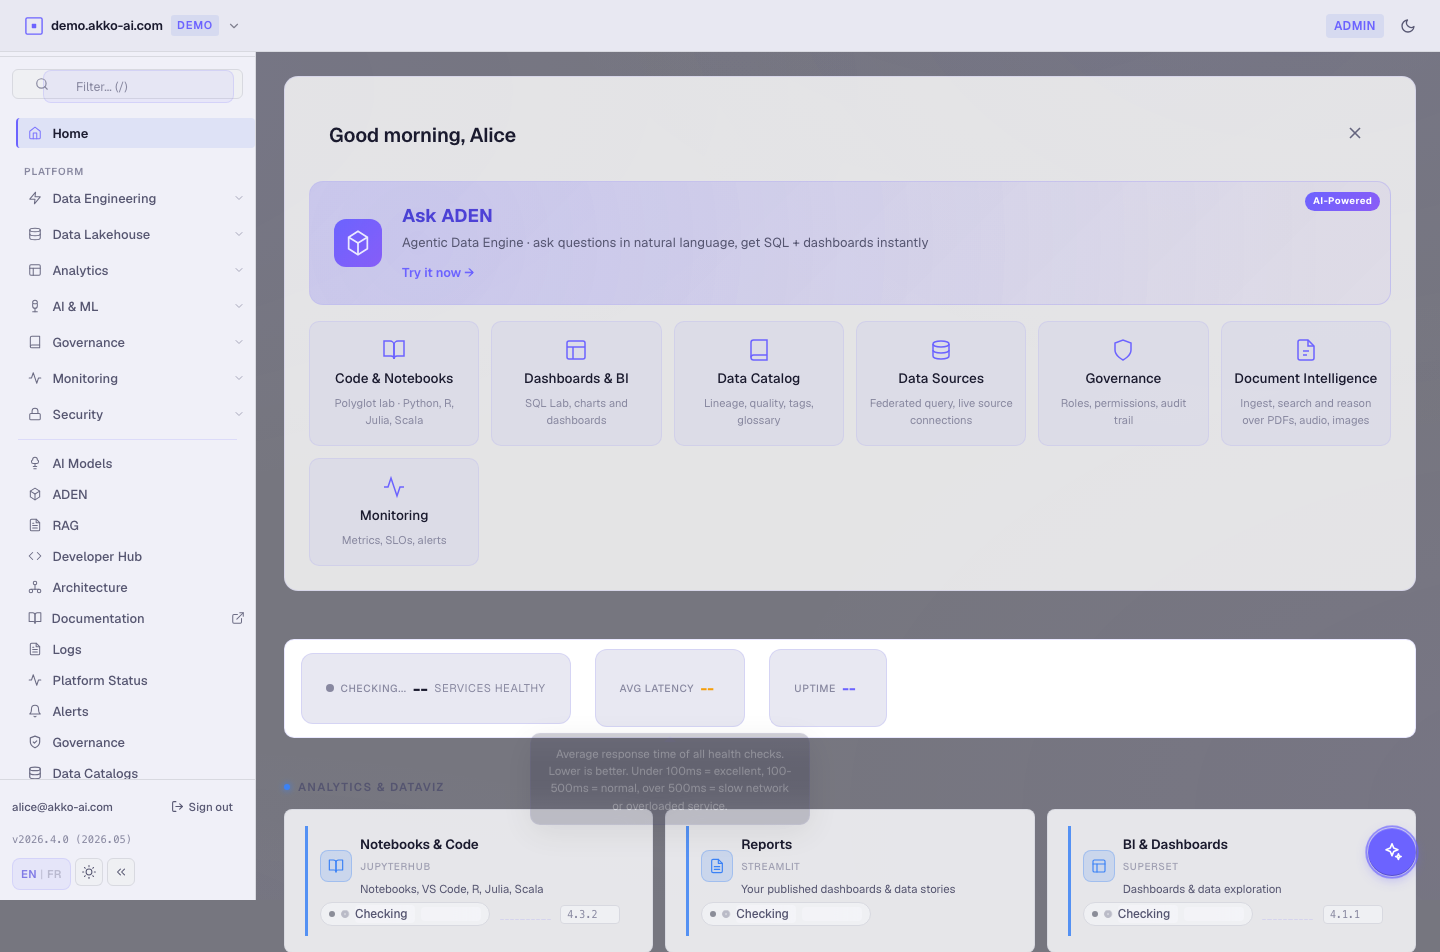
From the cockpit Home, click Open BI in the BI tile (or pick the BI entry in the sidebar).
You land on the BI home with two top tabs : Dashboards and SQL Lab.
Expected result : the Dashboards tab lists at least one pre-built dashboard called "Banking Fraud Overview".

Step 2 — Open the Banking Fraud Overview
Click the Banking Fraud Overview card.
The dashboard renders four charts :
| Chart | Type | Insight |
|---|---|---|
| Fraud rate (24h) | line | rolling 24h fraud rate |
| Top merchants by fraud count | bar | merchants with the most fraud events |
| Geo distribution | map | fraud incidents by country |
| Recent suspicious transactions | table | last 50 flagged transactions |
Expected result : the four charts render in under 5 seconds. The header shows the data scope chip and the last-refreshed timestamp.
Step 3 — Filter the dashboard
Use the filter bar at the top of the dashboard :
- Date range :
Last 7 days. - Amount ≥ :
1000. - Merchant contains :
coffee.
Click Apply.
Expected result : every chart updates in under 2 seconds. The result is restricted to large fraudulent transactions on merchants whose name contains "coffee".
Filters are server-side. They are translated into SQL
WHEREclauses on the governed query engine, never executed client-side.
Step 4 — Drill into a chart
Click any bar in Top merchants by fraud count.
The drill panel slides open with :
- The matching rows from the underlying table.
- The SQL that produced them.
- A "Open in ADEN" button to keep exploring.
Expected result : the drill panel renders. Closing it returns you to the dashboard with filters preserved.
Step 5 — Share with carol
In the dashboard header :
- Click Share.
- In the dialog, type
carol(or any analyst persona). - Optionally set an expiration date.
- Click Send link.
The shared dashboard opens for carol in her own session, with her row filters applied.
Expected result : a confirmation toast appears. Sign out, sign in as carol, open the share link — the dashboard renders with carol's scope.

Sharing never copies data. The link grants carol access to the dashboard definition. When she opens it, the SQL runs under her identity — so she may see fewer rows than you.
Bonus — Ad-hoc SQL Lab
Click the SQL Lab tab. You get a Monaco editor wired to the governed query engine.
Try :
SELECT region, COUNT(*) AS suspicious
FROM banking_curated.fact_transactions
WHERE is_fraud = TRUE
GROUP BY 1
ORDER BY 2 DESC;
Click Run.
Expected result : a result grid with one row per region. Click Save query to add it to your personal Saved Queries.
Troubleshooting
| Symptom | Likely cause | Fix |
|---|---|---|
| Dashboard renders blank | Cold engine | Wait 30 sec, refresh. |
| Chart shows "Permission denied" | Your scope excludes the underlying table | Switch persona or update the scope (chapter 07). |
| Share link 404 for carol | Link expired or revoked | Re-share. |
SQL Lab Run returns 504 |
Query engine warming up | Retry — second run is fast. |
| Filter bar greyed out | Dashboard is "view-only" for your role | Ask alice to grant edit. |
What you just learned
- BI dashboards render fast, filter server-side, and share without copying data.
- Dashboards open in the recipient's own scope — sharing respects RBAC.
- SQL Lab gives you an escape hatch for ad-hoc questions.
Next : 06 — Add a data source (Catalog).